
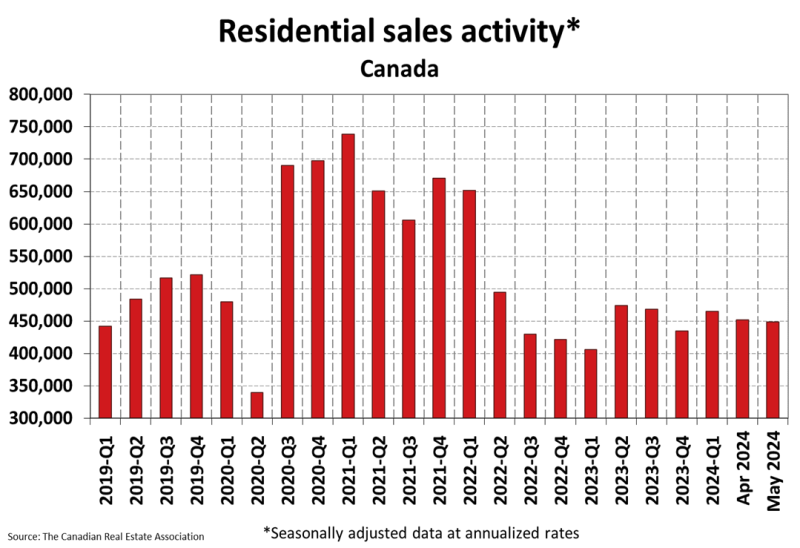
Home sales slipped in May and listings continued to build as prospective homebuyers largely remained on the sidelines.
Existing home sales in the month were down 0.6% from April and are down 5.9% from year-ago levels, according to data from the Canadian Real Estate Association. Sales of existing homes are now 13% below the 10-year average.
“May’s tepid performance kept the narrative of a soft spring selling season intact, as elevated borrowing costs and Bank of Canada uncertainty kept buyers on the sidelines,” noted Rishi Sondhi of TD Economics.
Regionally, weakness in the resale housing market was most pronounced in New Brunswick, where sales posted a 9.4% monthly decline, followed by Saskatchewan (-4.7%), Quebec (-2.4%) and Ontario (-2%).
While buyers remain hesitant about jumping into the market, more sellers are putting up the ‘for sale’ sign, which led to a 0.5% month-over-month increase in new listings. This also caused CREA’s months of inventory measure to rise to 4.4 from 4.2 in April.
“For their part, sellers are behaving as if it’s the spring season, with May’s modest gain in listings marking the second straight monthly increase,” Sondhi added.
National Bank Financial’s Daren King suggested this could be due to one of two reasons.
“This recent rise in listings might be explained by renewed confidence among sellers that they will be able to conclude a transaction in current market conditions,” he wrote in a research report. “However, it could also be due to growing financial distress among some owners, forcing them to put their property up for sale.”
He added that, “While we believe that this latter phenomenon remains marginal for the time being, it will be one to watch in the months ahead, as we expect the deterioration in the Canadian economy to continue.”
Downward pressure on home prices
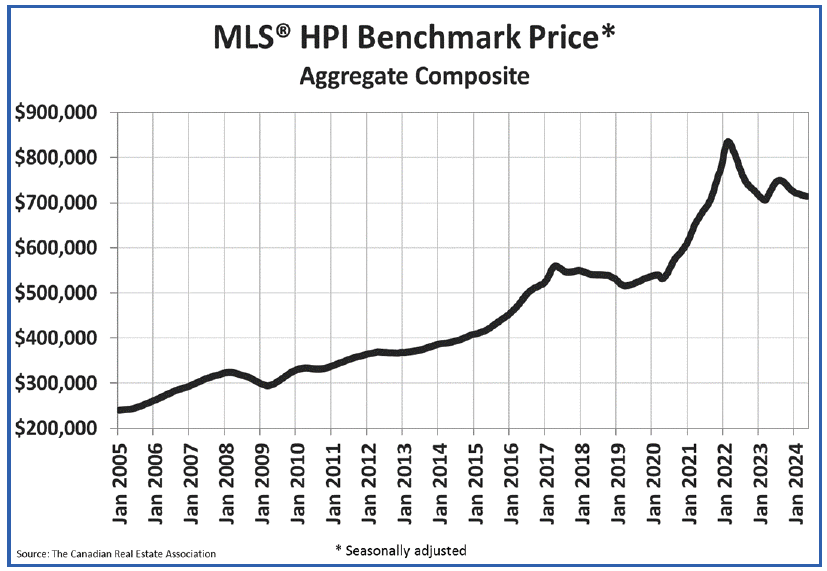
The weakening sales-to-new-listings rates, which eased to 52.6% in May from 53.3% in April, put some downward pressure on average prices. The non-seasonally adjusted average national home price is down 4% year-over-year to $699,117.
The MLS Home Price Index (HPI), which adjusts for seasonality, slipped 0.2% month-over-month and is down 2.4% from a year ago.
Expect firmer activity in June following BoC rate cut
Analysts expect activity to improve in June with the Bank of Canada’s June rate cut likely to provide buyers with more confidence that rates are now ready to fall.
“The Bank of Canada’s June 5 rate cut may have only been 25 basis points, but the psychological effect for many who have been sitting on the sidelines was no doubt huge,” wrote CREA senior economist Shaun Cathcart.
“We’re expecting a firmer performance in June, amid a decline in bond yields, consistent with the signal from the higher frequency data we track,” added TD’s Sondhi. “Moving forward, further rate relief is likely in the cards [from the Bank of Canada], which should set the stage for a stronger second half of 2024.”
Cross-country roundup of home prices
Here’s a look at select provincial and municipal average house prices as of May.
| May 2024 | Annual price change | |
|---|---|---|
| B.C. | $1,005,056 | -1.2% |
| Ontario | $890,634 | -3.7% |
| Quebec | $520,240 | +5.1% |
| Alberta | $502,625 | +8.3% |
| Manitoba | $371,224 | +3.6% |
| New Brunswick | $306,600 | +10.6% |
| Greater Vancouver | $1,187,200 | +2.2% |
| Greater Toronto | $1,117,400 | -3.5% |
| Victoria | $874,300 | +0.1% |
| Barrie & District | $807,300 | -1.8% |
| Ottawa | $651,300 | +1.2% |
| Calgary | $587,100 | +9.8% |
| Greater Montreal | $534,300 | +3.8% |
| Halifax-Dartmouth | $539,200 | +1.5% |
| Saskatoon | $397,200 | +5.8% |
| Edmonton | $392,700 | +6.1% |
| Winnipeg | $358,300 | +3% |
| St. John’s | $340,900 | +5.8% |
*Some of the movements in the table above may be somewhat misleading since average prices simply take the total dollar value of sales in a month and divide it by the total number of units sold. The MLS Home Price Index, on the other hand, accounts for differences in house type and size and adjusts for seasonality.